Statistics
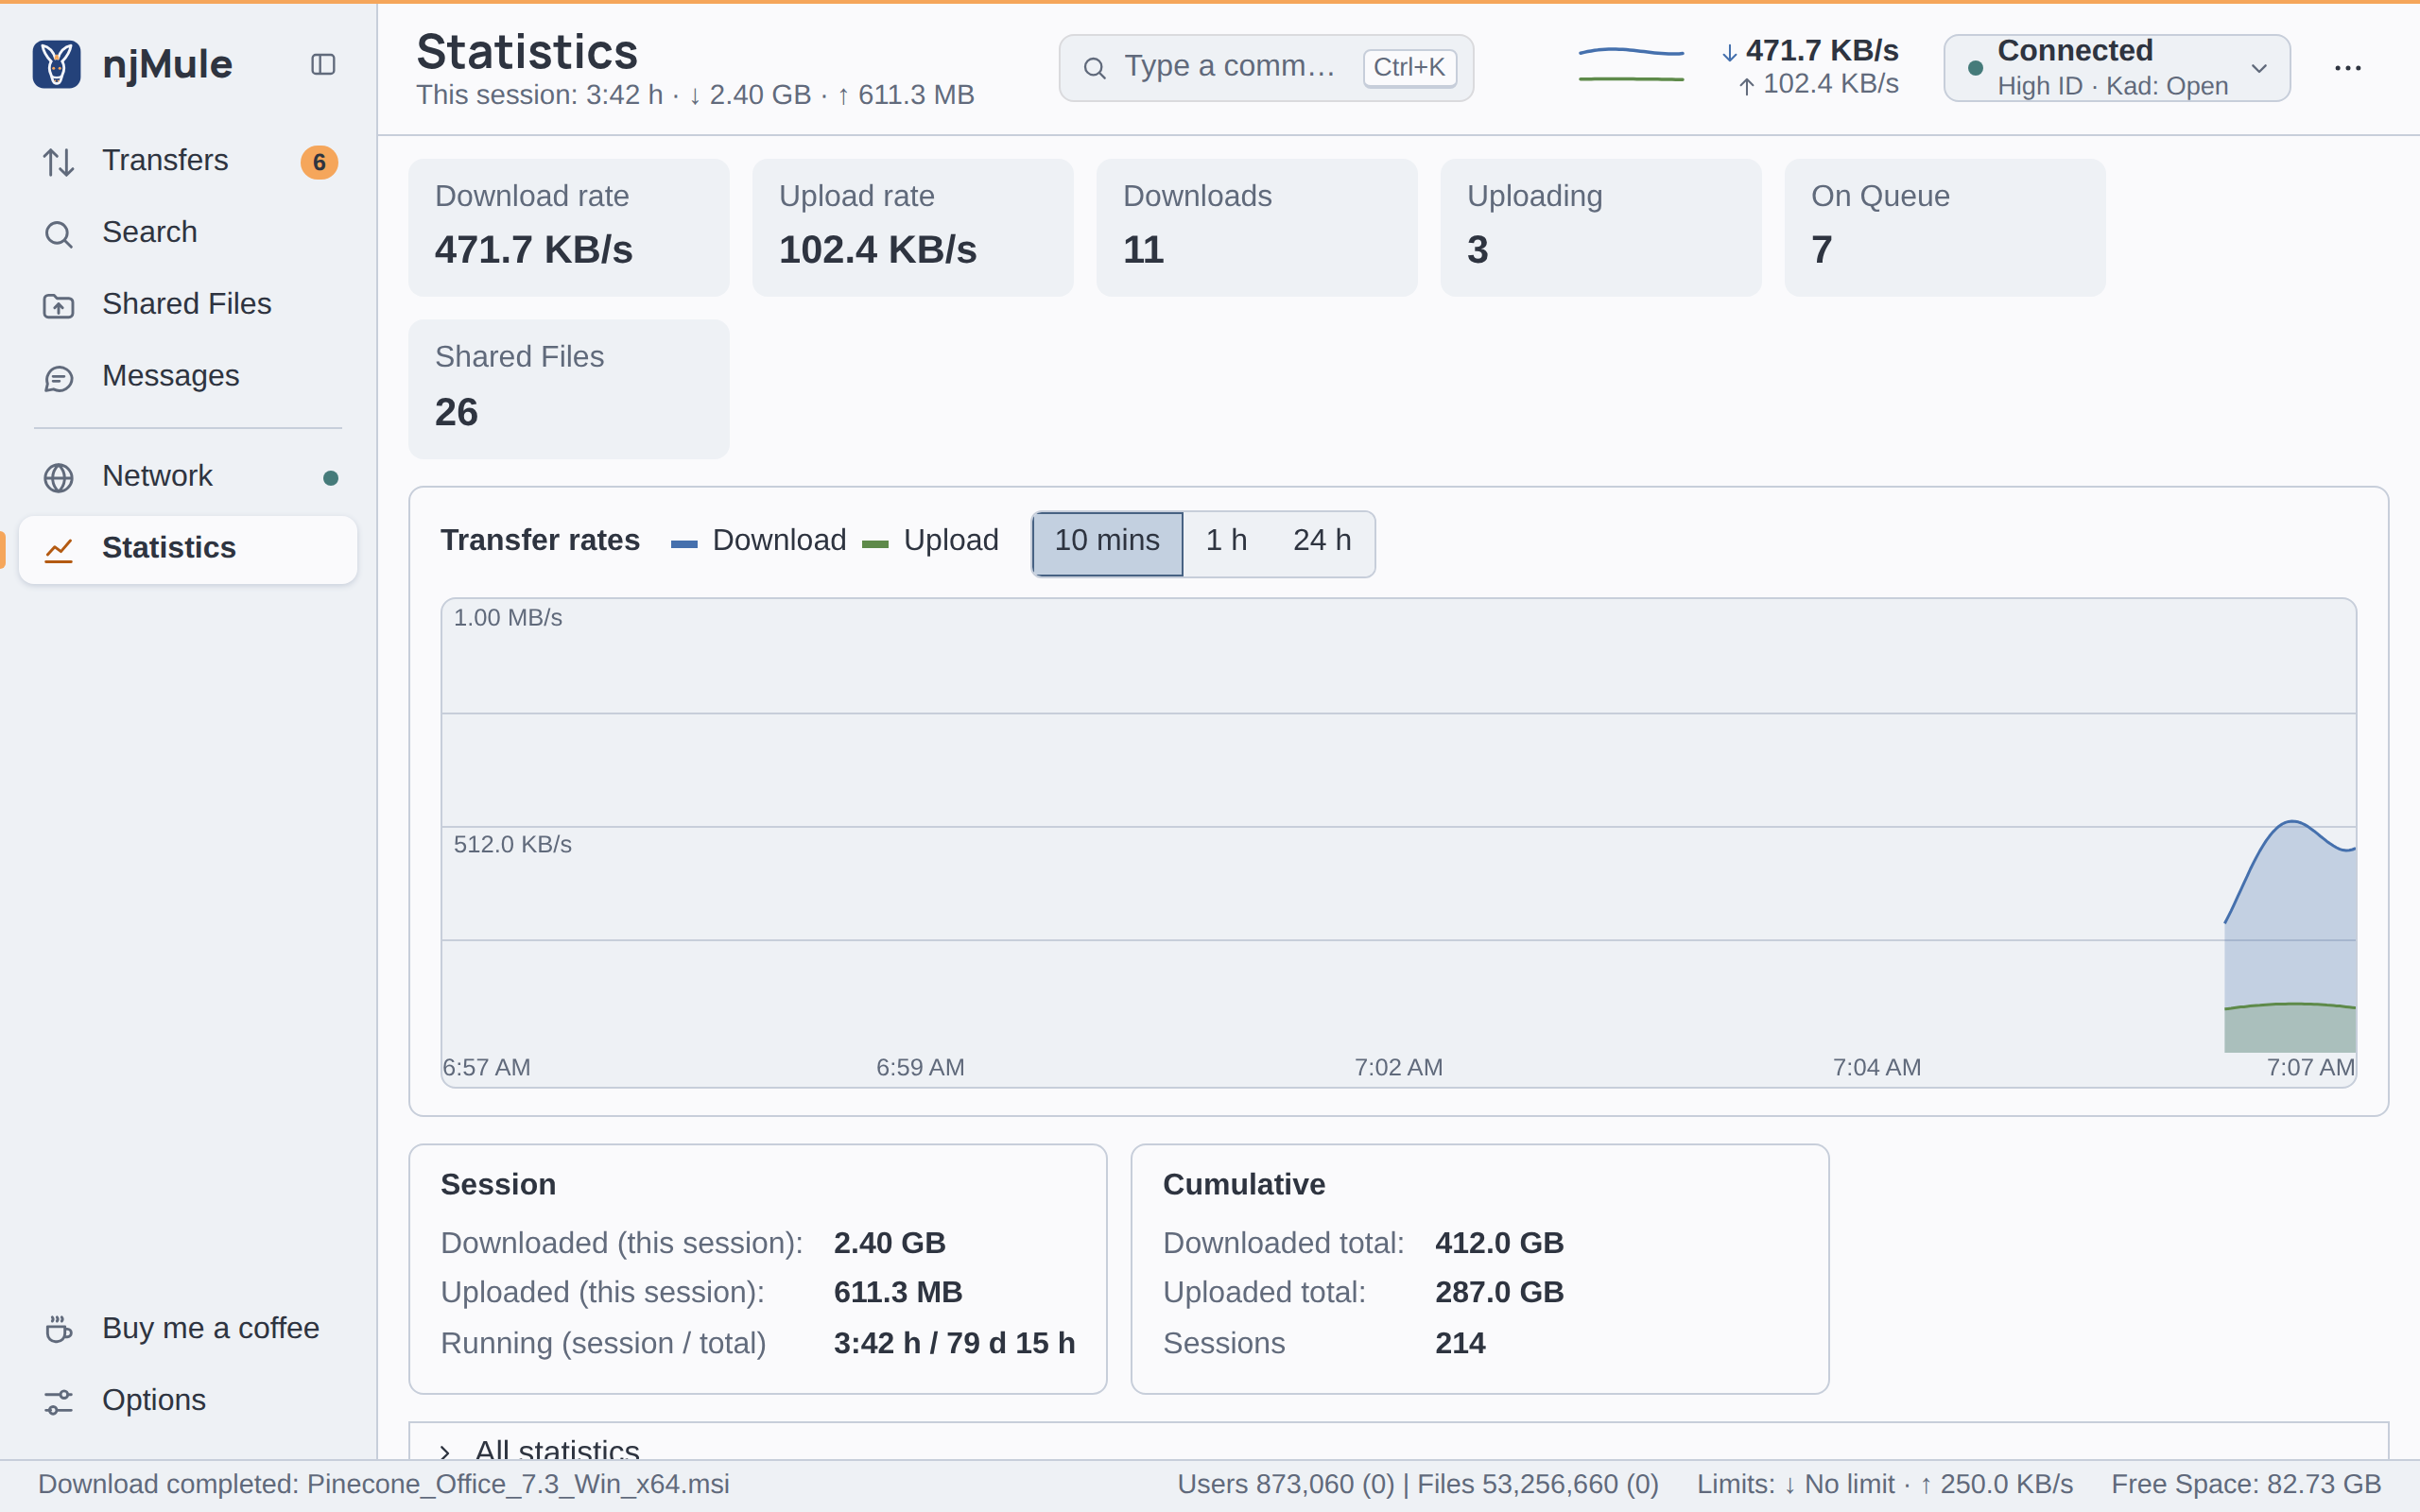
Statistics (Ctrl+6) shows what njMule moves now, how the rates went over
time, the totals of this session and of all sessions, and, on demand, every statistic it keeps. The
summary under the title tells how long this session has run and what it downloaded and uploaded, as
This session: 3:42 h · ↓ 2.40 GB · ↑ 611.2 MB.
What happens now
The cards at the top show, read every second:
| Card | What it counts |
|---|---|
| Download rate | What you download now, in all. |
| Upload rate | What you upload now, in all. |
| Downloads | The downloads in the list. |
| Uploading | The clients downloading from you now. |
| On Queue | The clients waiting in your upload queue. |
| Shared Files | The files you share. |
Transfer rates
The graph draws the download rate (blue) and the upload rate (green) over time; the legend names them, so the colours are never the only cue. Choose the span with the segment beside the title:
- 10 mins and 1 h: one point a second.
- 24 h: one point a minute, the mean of its seconds.
The scale on the left rounds to whole units of what it shows, and the times of the span are written under the lines. Rest the pointer on the graph to read the time and the two rates of that moment. While nothing moved in the span, the graph says Nothing was downloaded or uploaded in this time. Screen readers hear the graph as a sentence with the rates now and the highest.
Session and cumulative
| Card | Figures |
|---|---|
| Session | Downloaded (this session):, Uploaded (this session):, and Running (session / total): how long this session has run, then all sessions together. |
| Cumulative | Downloaded total: and Uploaded total: of all sessions, and the number of Sessions. |
The totals of all sessions are kept in statistics.properties in the profile; see
Files.
All statistics
All statistics, at the bottom, opens a tree of every statistic. Its branches stay open or closed as you leave them while the values change.
| Branch | What it holds |
|---|---|
| Transfers | Session UL:DL Ratio: and Cumulative UL:DL Ratio:, upload to download, as 1 : 2.5. |
| Uploads | For the session: Uploaded Data, the Overhead (the protocol's bytes besides the file data, over TCP and UDP), Active Uploads and Waiting Uploads. Cumulative: Uploaded Data. |
| Downloads | For the session: Downloaded Data, the Overhead, Active Downloads (chunks), Found Sources and Completed Downloads. Cumulative: Downloaded Data. |
| Connection | For the session: Average Downloadrate, Average Uploadrate, max. Downloadrate and Max Upload Rate. |
| Time Statistics | How long the session has run, and all sessions together. |
| Clients | The clients you download from or upload to, by program, with their share. |
| Servers | Working Servers, Failed Servers, Total, Users on Working Servers, Files on Working Servers, Total Users and Total Files. |
| Shared Files | How many, their Total size, the Average file size and the Largest Shared File. |
| Free Space | The free space of the disks of the Temporary Files and of the Incoming Files, with their folders. |
The statistics of each shared file are on Shared files; the speed limits, in the top bar, are explained on The main window.